
Swing Speed and Contact Efficiency: Profiling Well-Rounded Hitters
Colin Hofmeister
April 30th, 2025

Why Jung Hoo Lee Stands Out
I wanted to look at Jung Hoo Lee’s success this year and understand what sets him apart. He’s widely known as a contact-first hitter, yet he defies expectations by pairing his elite contact skills with swing speed higher than most of his contact-first peers such as players like Luis Arraez and Steven Kwan. While most contact hitters sacrifice bat speed to maintain control, Lee swings faster than you’d expect for someone with such a low whiff rate. This combination makes him an ideal model for what I call a well-rounded offensive profile.
Key Metrics
To explore this concept across multiple hitters, I used the following two stats:
- Average Swing Speed – measures the power and explosiveness behind a hitter’s swing. Higher swing speed gives a player more margin for error and the ability to drive the ball more effectively.
- Contact Efficiency = Squared Up % − Whiff % – a custom metric designed to reward players who make frequent, high-quality contact while avoiding swing-and-miss tendencies.
This combination helps identify hitters who are both power-efficient and bat-to-ball skilled—a blend often seen in the most consistent and productive offensive players.
General Filters
- BB% above 7% to eliminate the players who are not being selective while hitting this year.
- Over 100 PA, this was to eliminate the super low sample players, but I do acknowledge that all of this is low sample sizes working off just the first month of the season.
Player Comparison Table

Visual Analysis

Swing Speed vs. Contact Efficiency
This scatterplot compares swing speed to Contact Efficiency (defined as Squared Up % minus Whiff %). Players in the upper-right quadrant combine high bat speed with strong contact ability, traits that point to well-rounded and sustainable offensive profiles.
Juan Soto stands in a class of his own. He pairs elite swing speed with impressive contact efficiency despite a power-focused approach. It’s no surprise he leads the pack as he’s one of the best hitters in the game and now a $765 million dollar man.
Maikel Garcia, Josh Naylor, and Alex Bregman form a standout cluster of efficient hitters.
- Alex Bregman is off to an outstanding start in 2025, posting a .971 OPS and establishing himself as one of the best offensive performers in baseball. His swing speed and contact skills justify his value so far for the Boston Red Sox.
- Josh Naylor has a .907 OPS to start the season and projects for continued success based on his strong swing speed and high contact efficiency.
- Maikel Garcia, despite being part of a struggling Royals offense, has posted a .755 OPS and an above league average .349 xwOBA. Among this group, Garcia may be the most under-the-radar breakout candidate given his excellent contact efficiency and above-average bat speed.
Jung Hoo Lee, Adley Rutschman, and Geraldo Perdomo also show promising indicators.
- Jung Hoo Lee has been outstanding to start the 2025 season. His elite bat-to-ball skills combined with a surprisingly high bat speed in comparison to other contact hitters are what initially sparked this analysis. His profile suggests his success is no fluke.
- Adley Rutschman hasn’t produced at peak levels yet (98 OPS+), but his underlying metrics, especially the highest xwOBA in the group, suggest better results are coming. His contact efficiency and swing speed support that breakout potential.
- Geraldo Perdomo has quietly put together a stellar start for the Diamondbacks. He boasts the highest contact efficiency in this dataset, and his current production looks sustainable moving forward.
Conclusion
Bat speed and raw power will always be essential offensive tools, but when paired with elite bat control, as seen in the players highlighted, they create a uniquely valuable profile. By combining Squared Up % and Whiff % into a single contact efficiency metric and layering in swing speed, we gain a more complete picture of a hitter’s ability to produce consistent, high-quality contact.
This approach helps identify players with sustainable, all-fields offensive skill sets, those who blend aggression with precision. For scouting and analytics departments seeking reliable impact bats, the most promising candidates are often those who not only swing hard, but swing smart.
Breaking the Bank: MLB’s Shift Towards Ultra-Rich Contracts
Anthony Loh
April 22nd, 2025
Major League Baseball has experienced a dramatic shift in the valuation of player contracts. This evolution has altered not only the way the game is played but also the strategic decisions made by teams. This shift began with the emergence of transformational players like Shohei Ohtani—who shattered traditional roles—and has since expanded into a trend where financial commitments routinely climb into ultra-rich territory. The new market dynamics have compelled team owners and general managers to reexamine the true worth of on-field talent—and to engage in once unthinkable bidding wars.
Ohtani’s rise to prominence provided the first clear signal that the era of moderate contracts was drawing to a close—his ability as both a pitcher and hitter reset the market with a 700-million-dollar deal for 10 years. Franchises place a higher monetary premium on star power—pushing the envelope of contract negotiations to ensure they can secure the best players at any cost. His once-in-lifetime talent was paired with a negotiation style of deferred money that upended longstanding salary structures—and ignited a new focus on immediate impact as a metric for long-term investment.
In the wake of Ohtani’s breakthrough, his record contract was broken. Juan Soto’s behemoth contract of 765 million of 15 years without deferred money was given—embodying the modern era of financial commitments in baseball. Soto’s contract negotiations serve as a prime example of how the market has shifted—teams are willing to invest heavily in young players—recognizing that early peaks in performance can translate into long-term advantages. The escalating value of his contract is a testament to the belief that raw talent—when combined with proven performance—warrants the substantial financial risks undertaken by franchises in today’s market, even if it’s in the hundreds of millions. It shows the new power of superstars in the market and how much money they can ultimately command.
Last week, Vladimir Guerrero Jr. at the beginning of the season received his own 500 million dollar deal of 14 years. “Vladdy” followed a renowned baseball lineage from his father—and has quickly become a household name. Guerrero Jr.’s market value has soared since the year 2021—reflecting his on-field performance as well as the strategic long-term investments made by his team. His contract negotiations underscore the fact that players with the agents potentially have more leverage than they ever have, threatening to leave a team for free with no return, and as a result, modern teams are increasingly focused on securing young talent with the potential for high returns—both in terms of wins and in financial growth. This approach—rooted in a balance of caution and ambition—highlights the evolving priorities within the league.
In contrast to the ultra-rich deals emerging today, Aaron Judge’s contract—secured just a few off-season’s ago—once symbolized the pinnacle of compensation for top-tier hitters. At that time, Judge’s contract was a groundbreaking benchmark—establishing him in history books in the sport and setting a new standard for player value after his American League home run record-breaking season. However, Judge’s deal is compared with the contracts of players like Soto and Ohtani—it appears more modest. This contrast illustrates the rapid pace of inflation in MLB contracts—where what was once considered exceptional is now quickly surpassed by even higher offers. The accelerated trend in financial commitments underscores a broader shift in market perceptions and risk appetite.
The economic factors fueling this transformation are significant—and their impact is felt throughout the league. The ever-growing revenue streams from television contracts, sponsorships, and merchandising have provided franchises with greater financial flexibility—allowing them to invest in talent without the same constraints of previous eras. At the same time, teams face heightened competition—each striving to secure players who can deliver immediate results and carry the franchise forward into the future. This dual pressure has led to contracts that are characterized by generous guarantees and performance-based incentives—measures that are designed to mitigate risk while rewarding excellence.
The influx of large sums of money will create stipulations of the long-term implications for the sport—both in terms of competitive balance and overall sustainability. Critics argue that the rapid escalation in contract values might lead to an uneven playing field—where only the wealthiest franchises can afford to compete at the highest level. Others contend that these trends simply reflect a more sophisticated market—one that has adjusted to new revenue realities and embraced the idea that financial investment in talent is essential to success. Fueled by economic analysis—it remains central to the path of the future of baseball.
Short-Term Effects of the Torpedo Bat on Player Production
Anthony Loh
April 7th, 2025
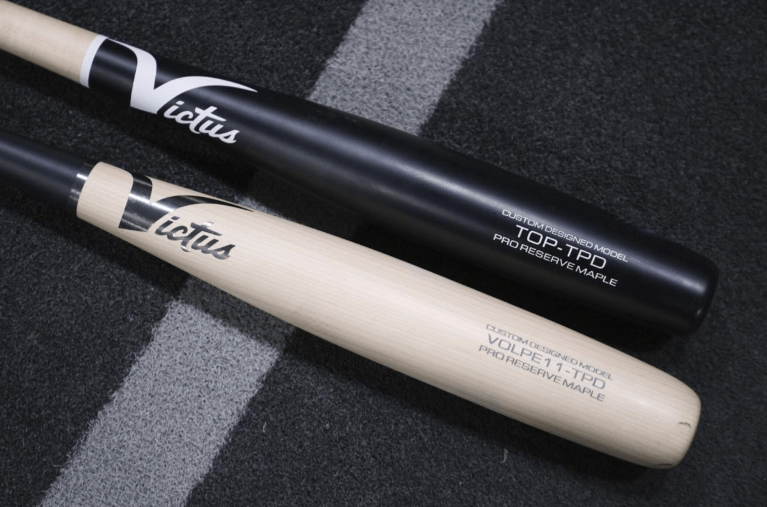
In the opening week of the MLB season, one innovation has captured widespread attention—the “torpedo bat.” First introduced by the Yankees last season, this cutting-edge design has quickly become the sport’s most talked-about storyline. Over opening weekend, New York unleashed a dominant offensive display, launching 15 home runs across just three games—including a franchise-record nine in a 20–9 rout of Milwaukee. This unprecedented performance has left many wondering: is baseball witnessing a true hitting revolution, or merely a fleeting phenomenon?
While the Yankees were the first team to utilize the torpedo bat, it was slugger Giancarlo Stanton who made it a staple—adopting it during last year’s postseason and slugging 7 home runs in just 14 games. The torpedo bat differs notably from traditional models, which taper evenly toward the handle. Instead, this bat features a barrel bulge that shifts mass directly into a hitter’s sweet spot—aiming to increase barrel frequency and optimize offensive output. During their opening series, seven different Yankees went deep in a single game, and the team opened one contest with back-to-back-to-back home runs on three consecutive pitches. Despite several teams having played more games, NYY currently leads the league in HRs.
The impact of the torpedo bat has spread rapidly across the league. By the end of the first week, dozens of players from various teams had adopted the design—and their performance metrics tell a compelling story. According to ESPN, hitters using torpedo bats collectively slugged 84 points higher than they did in the 2024 season (.490 SLG vs. .406). Additionally, their average launch angle jumped by about 3°, the home-run-per-fly-ball rate rose from 9.5% to 13.9%, and the average fly-ball distance increased by approximately 8 feet. Most notably, torpedo bat users slugged nearly 300 points higher against four-seam fastballs than they did last year—showing significantly more hard contact and carry-on heaters.
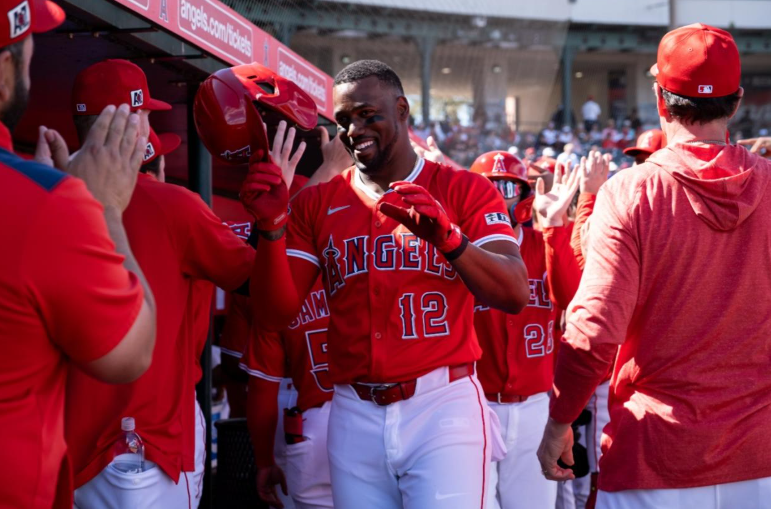
Among the individual standouts, Anthony Volpe’s red-hot start exemplifies the bat’s potential. Volpe is slashing .303/.361/1.119 with 4 home runs and 12 RBIs. His advanced metrics are equally impressive—posting a .450 weighted on-base average (wOBA) and a wRC+ of 192, making him nearly twice as productive as the average MLB hitter. Teammate Jazz Chisholm Jr. is also thriving, having launched 4 homers while producing a .237/.310/.915 line—powered in part by a 99th percentile barrel rate.
Further validation of the torpedo bat’s influence came from outside New York. Reds franchise cornerstone Elly De La Cruz—initially not among the first wave of adopters—made the switch just one week into the season. In his first game using the bat, De La Cruz erupted for 5 hits, all with exit velocities over 95 mph—including 4 north of 100. He crushed 2 home runs and racked up 11 total bases in a single game.
Yet, the transition hasn’t been universally successful. Mets star SS Francisco Lindor has struggled mightily—batting just .172 with no homers and a wRC+ of 47. Advanced stats further illustrate his woes, with a 0.0% barrel rate and no barreled balls to date. Although Lindor’s hard-hit rate of 41.7% remains respectable, he appears to be either battling misfortune or facing a steep learning curve with the new bat. Expected stats suggest potential improvement—his xwOBA sits at .307—but even that remains well below his usual All-Star standards.
Cody Bellinger, now a Yankee, also hasn’t quite broken out with the torpedo bat—at least not statistically. So far, he’s produced a modest .238/.296/.381 line with just one home run. However, underlying metrics paint a more optimistic picture. His average exit velocity of 90.6 mph and a 50% hard-hit rate both exceed league norms. His expected wOBA of .343—substantially higher than his actual mark of .284—suggests that he is due for positive regression.
The rise of the torpedo bat raises intriguing questions about its long-term impact. Early returns are undeniably promising—many users are seeing improvements in offensive output, launch angles, and barrel rates. But whether this marks a true evolution in hitting or simply a short-term spike remains to be seen. As the season progresses, the torpedo bat’s consistency will face its test—a full 162-game season.
The Sneakiest Offseason in the MLB
Nick Reed
February 26th, 2025
Six major league free agent contracts so far since November. Everyone who has signed so far is over 30 years old. Those numbers don’t even include minor league contracts given to Tim Anderson, JD Davis, and more. At first glance, it seems like the Angels are haphazardly assembling a retirement home community around Mike Trout in the hope of giving him one last chance at winning a playoff game. Despite appearances, it seems like the Angels are being smart.
Committing to a rebuild for the Angels began in the less successful side of Los Angeles as soon as Shohei moved across town. Mike Trout is a superstar when healthy, but his recent injuries and the team’s lack of support for Trout have caused 9 straight seasons below .500. When you aren’t winning with multiple MVPs, it is time to do something different.
The vision is a simple one. Utilize your newly acquired veteran leadership early in the season and spring training. If you win, continue to give Trout one last ride in Anaheim. If losing (most likely), trade everyone with a gray hair on their head. Trading will be the key piece for the 2025 Angels. Even if all of their free agent signings do not succeed, if just a few can be flipped before the deadline for young talent, that will be a victory. The Angels are not a prospect haven at the moment, but they definitely could be in the near future.
Here’s a quick rundown on how I feel each major Angel acquisition will do in 2025 and where I think they will end up if the Angels season does go poorly:
Jorge Soler (DH, 33y): As a consistent bat with playoff experience, I feel that Soler will be sitting at a 115 OPS+ and no defensive value come trade deadline, so a team with defensive pedigree that will need an offensive boost would be the suitor. He’ll be a Baltimore Oriole.
Yoan Moncada (3B, 30y): The youngest ‘veteran’ on this Angels team had a sneaky decent season in an injury-shortened 2024 and will be sitting at a 105+ OPS+ and decent defensive innings in the first half of 2025. I feel that the Angels will actually hold onto him in that scenario. With the uncertainty around Anthony Rendon’s injuries, they won’t move off a corner infielder who might have some gas left in the tank.
Tim Anderson (SS, 31y): A former star in the league with a batting title under his belt, Anderson is in desperate need of a comeback story. Sadly, I don’t think it is in the cards anymore. He struggled to put together any offensive value on some poor White Sox and Marlins teams, and I could see him not being on any major league roster by the end of the 2025 MLB season.
Yusei Kikuchi (SP, 33y): As a lefty with high breaking run value on his off-speed pitches, Kikuchi should be able to continue to be a quality starter this season. If the Angels can’t win behind him, he could be pitching for a contender that needs a quality lefty like the Cleveland Guardians.
Kyle Hendricks (SP, 35y): With only one decent season since the pandemic, Hendricks left the only team he had ever played for, the Cubs, and will try to find his footing on the West Coast. I don’t see it happening, and I feel his fate will be very similar to Patrick Corbin’s, who remains a free agent at the time of this article. He might not be on a major league roster by the end of the 2025 season.
Kenley Jansen (RP, 37y): Last but not least, Kenley Jansen is the most interesting veteran in this assortment of players. He has had at least a 112 ERA+ in every year of his career and was even an all star just 2 seasons ago (2023). If the Angels season goes south, he will get a lot of inquiries from contending teams, and I think that a team like the Milwaukee Brewers, who just lost their stud Devin Williams, will look to tap into Jansen’s skills and repertoire come playoff time.
This squad isn’t exactly the most highlighted team in the media coming into 2025, but I feel that many of these players could either click and succeed over general expectations or garner some quality prospects for the Angels in the future. In my humble opinion, their sneaky offseason is a much better strategy than many other teams in the MLB doing 1-2 moves and calling it quits (cough cough, Mariners).
Yankee’s Baseball Operations Quiz
Colin Hofmeister
November 13th, 2023
Recently on reddit someone who applied for an entry level job for the New York Yankees front office shared the test that the Yankees had him take during the hiring process. This tests the baseball analytics knowledge and general baseball IQ of the applicants. Here are the answers and reasoning behind each of the questions.
Which of the following could cause a player’s xwOBA to be higher than his wOBA?
- Hitting into a lot of hard-hit outs
- Picking up a lot of weakly-hit singles
- Spraying the ball to all parts of the field
- Facing weaker competition compared to league average
- Hitting a lot of cheap home runs that would be caught for outs in most ballparks
xwOBA is based on quality of contact meanwhile wOBA is results-based; so, hitting into a lot of hard-hit outs could lead to a higher xwOBA than wOBA.
–
Given no other information, which of the following players would you start tomorrow in a must-win game? (Assume each has 500 PAs so far this season)
- Player A: .850 OPS, 2 hits in last 35 plate appearances
- Player B: .800 OPS, 13 hits in last 35 plate appearances
Player A would be the answer here because even though Player B is “hotter” right now Player A has shown to have better statistics over the season which is a much large sample size to each of the players last 35 plate appearances.
–
Which of the following pitchers would you prefer to have on your team?
- Pitcher A: 3.50 FIP, 65% QS%
- Pitcher B: 4.50 FIP, 100% QS%
FIP is a much more indicative stat than Quality start percentage. Pitcher A is basically 2023 Blake Snell (3.44 FIP, 62.5% QS%) which is better than a pitcher who has a below average FIP (2023 league average 4.33) that has a complete start each time out.
–
Which of the following stats would most clearly indicate whether a hitter’s .350 AVG is due for regression?
- OPS
- OPS+
- wOBA
- BABIP
- OBP
- SLG
BABIP is the only stat listed that is predictive in nature and throughout a career a players BABIP will stay mostly the same so you can tell if the player has had a lucky or unlucky season.
–
Given no other information, which of the following hitters would you most want to have on your team?
- Hitter A: .240/.280/.550
- Hitter B: .260/.420/.410
- Hitter C: .320/.350/.480
Because each of these players have the same OPS and OBP is the more important part of OPS hitter B would be the player I’d rather have on my team.
–
Which of the following pitchers would you prefer to have on your team?
- Pitcher A: Pitches 4.2 IP and gives up 0 runs every time.
- Pitcher B Pitches 6.0 IP and gives up 2 runs every time.
The difference between the two pitchers is 1.1 IP and 2 R which is equivalent to a 13.50 ERA which all relievers in baseball are better than over a large enough sample size, so any MLB reliever would do better to cover that 1.1 innings than the difference between the pitchers. So, it would be better to have Pitcher A on your team.
–
Given no other information, which of the following catchers would you prefer to start tomorrow’s game? (Catcher ERA refers to the ERA of the pitchers pitching when a particular catcher is catching.)
- Catcher A: .850 OPS, 4.25 Catcher ERA
- Catcher B: .700 OPS, 3.50 Catcher ERA
OPS does a good job in describing a player’s value because it is mostly in that players control whereas catcher ERA is not a good stat in that it doesn’t consider the quality of the pitcher or the quality of the team they are playing. So, because OPS is a better stat and Catcher A is much better at it, Catcher A is who I would prefer to start tomorrow’s game.
–
When evaluating a Double-A pitching prospect, which of the following statistics is the most important?
- ERA
- W-L Record
- K/BB
K/BB is the stat that the pitcher has the most control over and is the most predictive, so K/BB is the best answer.
–
Which of the following statistics is most useful for evaluating a reliever?
- K%
- K/9
- LOB%
Strikeout percentage is better than K/9 and LOB% is not a very good stat so K% is the best answer.
–
Team A and Team B both currently have a 2-WAR third basemen and have the option of signing a 5-WAR third baseman to a one-year, $15M contract for next season. Team A is currently projected to win 70 games next season, while Team B is currently projected to win 88 games next season. Given no other information, which team would benefit more from signing the 5-WAR third baseman?
- Team A
- Team B
- Both teams would benefit equally
For a team on the edge of the playoffs with 88 wins, adding a 5-WAR third baseman brings them a lot closer to being World Series contenders whereas for Team A it would turn them from a bad team to a slightly better bad team.
–
Of the following hitting stats, which is most robust (i.e., value-driven, all-encompassing)?
- wOBA
- wRC+
- OPS
- TB
- OBP
wRC+ is a little better than wOBA because it adjusts for park factor and compares the player to a league baseline, so it is better there and also better than the other stats listed.
–
True or False: Teams need a balance between power hitters and contact hitters to be good enough to win the World Series.
- True
- False
You don’t NEED a balance of contact and power hitters in a lineup to be good. An all contact or all power lineup with a .900 OPS is better than a balanced lineup with .700 OPS.
–
Given no other information, which of the following players would you pick to start today’s game?
- Hitter A: .240/.305/.475 this season (414 PAs), 13-18 with 4 HRs against today’s starting pitcher
- Hitter B: .305/.325/.375 this season (389 PAs), 5-20 with 2 HRs against today’s starting pitcher
- Hitter C: .225/.420/.440 this season (403 PAs), 1-15 with 7 Ks against today’s starting pitcher
Because the large sample size helps to determine the quality of the hitter more and because we are given no further information on the players besides there recent at bats against todays starting pitcher it is best to look at the hitter’s season stats which means Hitter C should be the choice because his OPS is highest.
–
Which of the following affects wOBA but not xwOBA?
- Quality of contact
- Quality of competition
- Defense on batted balls
- Leverage of plate appearance
Quality of competition and leverage of plate appearance affects neither xwOBA or wOBA, quality of contact affects xwOBA but not wOBA, and defense on batted balls can affect a players wOBA but not their xwOBA.
Which of the following players was more valuable on stolen base attempts?
- Runner A: 42 SB, 23 CS
- Runner B: 12 SB, 2 CS
Even if a runner steals a lot of bases if they get caught that often they have a negative impact overall, so runner B is more valuable.
–
A 23-year-old prospect has a 1.50 ERA in 5 MLB starts this year. Given no other information, which of the following do you think will be closest to his MLB performance as a starter next year?
- 1.00 ERA
- 1.50 ERA
- 2.00 ERA
- 2.50 ERA
- 2.75 ERA
- 3.00 ERA
Out of the options given it is most likely that the pitcher will have an ERA of 3.00 because in 2023 only 5 pitchers had an ERA below 3.00 so it is unrealistic to predict a rookie starter with a small sample size of 5 games will be in the top 5 pitchers in MLB.
–
Given no other information, which of the following pitchers would you most want to be on your team next year?
- Pitcher A: 60 IP, 90 K, 10 BB, 3.00 ERA, 0 SV, 5 BS
- Pitcher B: 60 IP, 60 K, 30 BB, 2.50 ERA, 20 SV, 0 BS
- Pitcher C: 60 IP, 90 K, 40 BB, 2.75 ERA, 50 SV, 5 BS
FIP, which is a much better pitching stat than the ones listed here uses strikeout rate, walk rate, and HR rate. Pitcher A is tied for the best strikeout rate and has a much better walk rate than the rest and HR rate is unknown between the 3 so Pitcher A would be the best option.
–
True or False: “Openers” can work for a few games but trying to use them in 40-50 games per year would be an unsustainable strategy.
- True
- False
The Tampa Bay Rays have basically proved this false by using an opener 151 times between 2018 and 2022 going 91-60 in those games thus showing that the use of openers can be sustainable.
–
Given no other information, which of the following hitters would you prefer to have on your team?
- Hitter A: .300/.450/.600
- Hitter B: .000/1.000/.000
Although it is unrealistic to have a player who never gets out over a large sample size if it were possible, it would provide more value than Hitter A. So, Hitter B who never gets out is more valuable to a team.
–
Your starter has a 3.20 FIP on the season and has thrown five shutout innings so far (18 batters faced) in today’s must-win game. He has thrown 71 pitches so far today. You have five rested relievers in your bullpen with FIPs between 3.20 and 3.40 for the season, and you are currently winning 1-0. Given no other information, what would you do for the sixth inning?
- Stick with your starter
- Bring in a reliever
When a starter goes through the lineup for a third time their stats take a big hit and because there is not much of a drop in FIP from the starters to relievers because it is the hitters 3rd time seeing the starter it is better to bring in a reliever.
–
Given no other information, which of the following hitters would you pick to hit with the game on the line in the 9th inning of a must-win game?
- Player A: .750 OPS, .350 AVG w/RISP this season (500 PAs)
- Player B: .800 OPS, .250 AVG w/RISP this season (500 PAs)
Player B would be better because OPS is a more descriptive stat, and it has a much larger sample size so player B would be better off in this situation.
–
Do you think player opt-outs are better for the player, better for the team, or mutually beneficial?
- Better for the player
- Better for the team
- Mutually beneficial
Player opt-outs are better for the player because they allow the player to have the choice to stay on a current contract if they would not get that much money in free agency or allow the player to opt-out of a contract that they are out preforming to go get more money in free agency.
–
True or False: An elite reliever is worth less to a team that already has six elite relievers than to an overall equally talented team that has only one elite reliever. (Assume both teams use standard 5-man rotations with starters who average 5 IP/GS.)
- True because the first team doesn’t have as many high-leverage innings to spread around.
- False because you can never have enough elite relievers, and the first team might end up having injuries.
This is true because in the false answer it says you can NEVER have too many elite relievers but there are many situations where having too many elite relievers would not be beneficial, such as having 9 elite relievers but only 8 bullpen spots. This question also deals with the economic principle of diminishing returns where there is a decrease in marginal output as the single factor of production is increased, meaning each additional reliver is less valuable to the team than the previous one.
–
In which of the following scenarios is it smarter to run a contact play with a runner on third (i.e., the runner breaks for home as soon as the ball hits the bat)?
- With 0 outs
- With 1 out
Because it is more valuable to have a runner on third with no outs than with one out it is smarter to run a contact play with a runner on third with one out.
–
Given no other information, which of the following pitchers would you prefer to start Game 7 of the World Series if it were tomorrow?
- Pitcher A: 2.50 FIP in regular season (200 IP), 5.50 FIP in playoffs (20 IP)
- Pitcher B: 4.50 FIP in regular season (200 IP), 1.50 FIP in playoffs (20 IP)
Because the regular season is a larger sample size it is better to judge a pitcher’s talent off of that and Pitcher A is much better, it would be better to start Pitcher A. Pitcher A FIP is like 2011 Cy Young winning Clayton Kershaw vs. Pitcher B who is below league average in FIP.
–
Which element of a hitter’s “triple slash” line is most important to his offensive value?
- Batting Average
- On-Base Percentage
- Slugging Percentage
OBP is the best choice here because OBP is better than batting average and 1 point of OBP is worth about 1.4 points of slugging percentage, so OBP is most important to a player’s offensive value.
–
Of the following pitching stats, which is most robust (i.e., value-driven, all-encompassing)?
- WHIP
- FIP
- ERA
- QS%
- LOB%
FIP is the stat that most correlates to run prevention of the stats listed.
–
Given no other information, which of the following relief pitchers would you prefer to have on the mound in the 9th inning of a must-win game?
- Pitcher A: 2.50 FIP, 3 consecutive appearences with a blown save
- Pitcher B: 3.00 FIP, 3 consecutive appearences with a successful save
Putting more value on larger sample size and more descriptive stats Pitcher A is the better choice.
–
True or False: AVG with RISP is a good measure of offensive talent because good hitters find a way to drive in runs.
- True
- False
Splits with runners in scoring position are usually a very small sample size so it is not great to measure a player’s offensive talent off of that and there are also much better stats than batting average to judge a hitter’s offensive production. So AVG with RISP is not a very good measure of offensive talent.
–
Given no other information, which of the following teams would you prefer to face in a five-game playoff series?
- Team A: 98-64 regular season record, 1-5 vs. your team in the regular season
- Team B: 92-70 regular season record, 6-0 vs. your team in the regular season
Because the regular season record is a much larger sample than 6 games against a team it shows that over time Team B is worse so you would rather play them in a five-game playoff series.
World Series Preview/Predictions
Colin Hofmeister
October 26th, 2023
The World Series begins on Friday between the Texas Rangers and the Arizona Diamondbacks. Both teams have taken the unlikely route to the postseason starting from the Wildcard round and going all the way to the World Series. Texas has been led by their powerful streaky hitting this postseason alongside strong starting pitching performance most notably by Nathan Eovaldi and Jordan Montgomery meanwhile Arizona has found success through being a threat on the bases stealing 4 bags in NLCS Game 6 and 3 more in Game 7 along with strong relief pitching especially from Ginkel and Sewald who both have not allowed a run all postseason. While these teams are built very differently in Texas having the 8th largest payroll headlined by a half-a-billion-dollar middle infield between Seager and Semien vs. The Diamondbacks who stack up 23rd in the league in payroll and their most expensive player is Starting pitcher Madison Bumgardner who was released in April; both of these teams have made it to the Fall Classic, and he are my thoughts on how it will go down.
Arizona’s key to outscoring Texas is through small ball but can they do it?
Texas’ offense is a known threat going into this series as they were 3rd in baseball in home runs during the regular season and have shown throughout the playoffs that they can have a big inning at any time. Arizona however stole the second most bases in baseball this season and led the league in sacrifice hits. Ketel Marte, Lourdes Gurriel Jr., and Corbin Carroll have been hot heading into the World Series and if they can receive help from power bat Christian Walker who has struggled this postseason, they do have the capability to hold their own against the Rangers however I believe the Texas offense will not slow down and can keep them in or ahead in every game this World Series.
Battle of Bullpens
Arizona’s three-headed monster of Thompson, Ginkel, and Sewald in the back half of their bullpen has the ability to lock down any game the Diamondbacks find themselves in the lead in heading into the later innings. The opposite is the case for the Rangers bullpen who have struggled all season posting a 48% save percentage during the regular season to give Arizona a great chance to get back into games late. If Arizona can take the lead or have the lead in the 8th or beyond, I think they will be able to hold on and win.
Starting Pitching
The duo of Eovaldi and Montgomery have been very strong all postseason with both posting an unbeaten record. The problem for Texas is what will they get from the rest of their rotation. Scherzer, who is fresh off injury, has not looked as sharp as he usually does but that can easily change as he gets plenty of rest going into the World Series and we all know the upside of having the 3-time Cy Young winner in their rotation. For Arizona their ace, Zac Gallen, has not been as sharp as they would like, posting a 2-2 record with a 5.24 ERA this postseason. He will need to turn it around if the Diamondbacks want a chance to stay in this series. Merrill Kelly, who has been great for the Diamondbacks this postseason is looking to continue his success and when he has all his pitches working as he did in Game 6 of the NLCS he is almost unhittable even for the intimidating Texas lineup. D-Backs rookie Brandon Pfaadt looked very good against the Phillies in the NLCS and needs to continue that success for Arizona to have a chance to beat the Texas Rangers.
Predictions
– Texas scores 5+ in every game they win.
– Ketel Marte’s postseason hitting streak ends in Game 2.
– Texas loses on the road for the first time this postseason.
– Diamondbacks steal at least 2 bases in each win.
– Marcus Semien World Series MVP.
– Rangers in 5
Building a Hitting Prospect Projection Model
Joshua Mould
February 1st, 2021
How well do you think you can predict the future of a minor leaguer? My computer may be able to help. Towards the end of the regular season, I found the prospects page at FanGraphs and started experimenting with it. I have always had a lot of fun thinking about the future and predicting outcomes, so I decided to try to build a model to predict whether or not a prospect would make it to the majors. I had all the data I needed thanks to FanGraphs, and I had recently been looking into similar models built by others to figure out how I could accomplish this project. I realized that all these articles I was reading detailed the results of their models, but not the code and behind-the-scenes work that goes into creating them.
With that in mind, I decided to figure it out on my own. I had a good idea of what statistics I wanted to use, but there were a few issues I needed to consider before I started throwing data around:
- Prospects can play multiple years at a single level.
- Not all prospects play at all levels of the minor leagues.
- What do I do with players who skipped levels?
- How can I make this model useful and practical?
Prospects playing multiple years at a single level isn’t too difficult to deal with because I can just aggregate the stats from those seasons. The fact that not all prospects play in every level of the minor leagues before reaching the majors is tough, however, because that makes for a lot of missing data that needs to be handled before building the model. I decided to replace all the missing values with the means of the existing data, and I created variables to indicate whether or not a player’s season stats for that particular level of the minor leagues were real. To make this model useful, I would want to take out certain variables. For example, I figured I wouldn’t need or want Triple-A stats included in the model because typically once a player has reached that level of the minors, you are more interested in how well they will do in the majors.
I defined a prospect as any player under the age of 26 in the minor leagues, and I only used stats from the following minor league levels: rookie, Low-A, Single-A, High-A, and Double-A. I also needed to get rid of current prospects from my training data (because they haven’t been given the chance to get to the majors yet) so I removed the names who currently exist on the FanGraphs prospect page. I also took out players who didn’t get past rookie league, because I wasn’t nearly as interested and they made up a huge majority of the seasons that I collected. Side note: It would be really cool project to take college stats and use them to project whether or not a player would make it past rookie ball given the number of washouts who made up my data… maybe a future project.
I used a logistic regression model because of the binary outcome variable that I wanted to predict: Whether a player makes it to the majors or not. The predictor variables I wanted to use were age, BB%, K%, BABIP, ISO, GB%, SwStr%, and SB%. I chose these because these stats appealed to me as variables that isolate certain skills and could have predictive power. I calculated SB% a little differently than the conventional calculation, using it the way Chris Mitchell did in his article at The Hardball Times. He calculated the proportion of times that a player would attempt to steal based on opportunities given with the following formula:
SB% = (SB+CS) / (Singles + Walks + HBP)
For the response variable — major leaguer or not major leaguer – I classified a major leaguer as being a player who had 600 plate appearances or more in the bigs.
Once I had these logistics figured out, I began to put the model together. I started off with every statistic listed above from each level of the minor leagues, and I slowly narrowed it down to only variables of significance that would reduce overfitting. I used the AUC/ROC curve to evaluate the model, but because the data is so lopsided in that nearly 95% of players in my training set “never made it to the majors,” I needed to use a different baseline than conventional AUCs for the model. The exact percentage of players who “never made it to the majors” in my training set was 93.52%, so a model that simply says none of the players ever make it would have a 93.52% accuracy. That means I was shooting for an AUC of 93.52 or higher so that I could match the default model while also providing some insight on which players actually do make it to the majors.
I ended up including the following variables/stats in the final model:
- SB% in Low-A
- BB% in High-A
- ISO in High-A
- Age in Double-A
- SO% in Double-A
- BABIP in Double-A
- ISO in Double-A
- SB% in Double-A
- “Real or Not” in Rookie
- “Real or Not” in Double-A
These variables make sense given there’s mostly representation from the higher levels of the minors. If you get to Double-A, there’s a much greater chance that you get to Triple-A or even go straight to the majors. It also of course bodes very well if you do well at Double-A, since this is much closer to playing against major league competition. I also wasn’t expecting GB% and SwStr% to be hugely significant predictors either because they are mostly made up for in BABIP and SO%.
In my training set I ended up with an AUC of .952 and the following plot of the AUC-ROC curve:

In the test set I ended up with an even better AUC of .955 and the following plot of the AUC-ROC curve:

At the beginning of this project, I didn’t have much experience with the AUC-ROC curve. The only method of evaluating a logistic model that I had known of was the confusion matrix, which I now know is not always helpful, especially when a continuous predictor variable is more valid. In addition, when my AUC first appeared very high, I was surprised because I didn’t think I’d be able to build such a strong model that simply. I looked into it more and found that the reason it was so high is because the default model that predicts all prospects to fail would be extremely accurate, so unfortunately the high AUC was not because I was a natural modeling guru. The imbalance between those who make the majors and those who don’t in my training set is so lopsided that it makes my model seem extremely effective right off the bat before I had even taken out any variables.
Having 50 variables and the accuracy appear so high is a tricky illusion, and in the case of a model like this, leads to overfitting. I knew from the beginning that I would need to reduce the variables in the model, but it was very interesting to see the results of the overfitting appear in the data. With my overfitted predictions, there was a large difference between the predictions for those who made it to the majors and those who didn’t. This resulted in a much lower AUC in the test set and made for a poor model. In playing around with it at some points I found the model ending up with an AUC of 1, which meant perfect prediction in the training set and isn’t really useful on any other data.
Let’s take a look at the data. Here are the predictions from the top 25 players in WAR between 2006 and 2019:
| Rank | Name | Predictions | WAR |
|---|---|---|---|
| 1 | Mike Trout | .99336898 | 76.0 |
| 2 | Buster Posey | .01242905 | 52.7 |
| 3 | Andrew McCutchen | .86624516 | 49.7 |
| 4 | Ryan Braun | .8791191 | 43.9 |
| 5 | Josh Donaldson | .31081991 | 42.3 |
| 6 | Paul Goldschmidt | .7544491 | 41.4 |
| 7 | Mookie Betts | .99238981 | 40.2 |
| 8 | Giancarlo Stanton | .96553409 | 39.7 |
| 9 | Freddie Freeman | .86814365 | 38.0 |
| 10 | Brett Gardner | .62614691 | 37.6 |
| 11 | Jonathan Lucroy | .24545985 | 37.0 |
| 12 | Justin Upton | .99592404 | 36.8 |
| 13 | Bryce Harper | .98098739 | 36.7 |
| 14 | Manny Machado | .96577834 | 35.8 |
| 15 | Jose Altuve | .97283983 | 35.2 |
| 16 | Yasmani Grandal | .60096726 | 34.3 |
| 17 | Christian Yelich | .88193566 | 34.3 |
| 18 | Jason Heyward | .99870464 | 32.9 |
| 19 | Kyle Seager | .59719139 | 32.3 |
| 20 | Nolan Arenado | .7804618 | 32.2 |
| 21 | Anthony Rizzo | .87364824 | 30.3 |
| 22 | Jacoby Ellsbury | .88251289 | 30.3 |
| 23 | Matt Carpenter | .20256203 | 30.2 |
| 24 | Lorenzo Cain | .19193733 | 29.0 |
| 25 | Francisco Lindor | .95153247 | 28.9 |
The most obvious thing to point out is Buster Posey’s abysmal prediction of around 1% chance to make it to the show. This makes sense given his very short minor league career before getting to the majors, which consisted of about 10 games in rookie ball and Low-A combined before 80 games in High-A. He went to Triple-A for a little bit (which my model doesn’t take into account) and then went to San Francisco after just a couple seasons in the minors. Despite the fact that he’s a former MVP and three-time World Series champ, I found that this is a win for the model because in general guys who play very few games in the lower minors and don’t play Double-A probably aren’t going to make it to the majors, and Posey was a true outlier and top prospect. This is a place where it might help to factor in college stats to a model so that it might start to see standouts like Posey rush to the majors.
Another thing to note is that just like there needed to be a baseline for the AUC because of the lopsided results, there also needs to be a baseline for the predictions. We need to understand that the average minor league player’s chance to make it to the big leagues is around 10%. That means that those who have predictions far above that are likely to be very, very good.
Next I took the top 500 prospects or so from FanGraphs and applied the model to them. The top 50 predictions from the model are below. There are a few names you might notice are missing from the top predictions, including players like Wander Franco, who simply hasn’t had enough playing time at levels the model likes the most, such as Double-A. We may never even see him play at Double-A because of this past minor league season’s cancellation and the possibility he is called up early in 2021.
| Rank | Name | Age | wRC+ | Prediction |
|---|---|---|---|---|
| 1 | Jarred Kelenic | 20.3 | 142.958722 | .9778224 |
| 2 | Luis Robert | 22.2 | 150.628621 | .94175248 |
| 3 | Isaac Paredes | 20.7 | 132.283928 | .94124406 |
| 4 | Jo Adell | 20.6 | 137.274165 | .93936551 |
| 5 | Nick Madrigal | 22.6 | 119.707385 | .93719679 |
| 6 | Dylan Carlson | 21.0 | 130.198868 | .93300778 |
| 7 | Andrés Giménez | 21.2 | 110.71173 | .90559978 |
| 8 | Gavin Lux | 21.9 | 156.305912 | .89909189 |
| 9 | Vidal Bruján | 21.7 | 134.759559 | .89442025 |
| 10 | Keibert Ruiz | 21.3 | 94.7038924 | .88379281 |
| 11 | Daulton Varsho | 23.3 | 145.465397 | .8596463 |
| 12 | Taylor Walls | 23.3 | 133.86938 | .83855902 |
| 13 | Brendan Rodgers | 23.2 | 123.813903 | .83243674 |
| 14 | Jorge Mateo | 24.4 | 80.0309606 | .82703768 |
| 15 | Heliot Ramos | 20.2 | 119.050502 | .80713648 |
| 16 | Luis Garcia | 19.5 | 95.1615171 | .79559999 |
| 17 | Cristian Pache | 21.0 | 114.751941 | .78913128 |
| 18 | Yusniel Diaz | 23.1 | 135.15202 | .76919141 |
| 19 | Drew Waters | 20.8 | 132.118829 | .757519 |
| 20 | Mauricio Dubón | 25.3 | 103.601284 | .75656152 |
| 21 | Alec Bohm | 23.2 | 146.943753 | .74234879 |
| 22 | Austin Hays | 24.3 | 92.4417251 | .73148647 |
| 23 | Anthony Alford | 25.3 | 94.0627314 | .72035194 |
| 24 | Leody Taveras | 21.1 | 95.1196241 | .71424263 |
| 25 | Carter Kieboom | 22.2 | 124.636012 | .71109895 |
| 26 | Oneil Cruz | 21.1 | 137.430851 | .70463246 |
| 27 | Jonathan Araúz | 21.2 | 98.2112133 | .70432122 |
| 28 | Lucius Fox | 22.3 | 99.4395713 | .69819464 |
| 29 | Abraham Toro | 22.9 | 137.205164 | .6836528 |
| 30 | Jason Martin | 24.2 | 99.7303846 | .68025898 |
| 31 | Luis Barrera | 24.0 | 122.854608 | .67851418 |
| 32 | Joey Bart | 22.9 | 140.693228 | .67710447 |
| 33 | Khalil Lee | 21.3 | 117.048416 | .66450715 |
| 34 | Royce Lewis | 20.4 | 111.059658 | .64479302 |
| 35 | Ryan Mountcastle | 22.7 | 118.774006 | .64439561 |
| 36 | Ke’Bryan Hayes | 22.8 | 110.540248 | .64018493 |
| 37 | Brandon Marsh | 21.9 | 118.81056 | .61958271 |
| 38 | Thairo Estrada | 23.7 | 74.5093524 | .61888417 |
| 39 | Luis Santana | 20.3 | 126.071404 | .61490306 |
| 40 | Daz Cameron | 22.8 | 98.7950409 | .60065321 |
| 41 | Jorge Oña | 22.8 | 103.290552 | .59374655 |
| 42 | Josh Lowe | 21.7 | 113.863437 | .58122182 |
| 43 | Randy Arozarena | 24.7 | 133.414235 | .56952746 |
| 44 | Yonny Hernandez | 21.5 | 118.231353 | .56648887 |
| 45 | Domingo Leyba | 24.1 | 107.683533 | .5605087 |
| 46 | Alex Kirilloff | 22.0 | 150.321047 | .55860194 |
| 47 | Omar Estévez | 21.7 | 113.840938 | .53150457 |
| 48 | Sheldon Neuse | 24.9 | 99.6412136 | .52316645 |
| 49 | Connor Wong | 23.5 | 131.336263 | .50716012 |
| 50 | Jahmai Jones | 22.2 | 93.252696 | .49505114 |
It’s really cool to see this kind of thing work in a fortune-telling way. Predicting the future is fascinating to me, and even more satisfying when predicted correctly. Many of these players have already been brought up to the majors and have performed well. Others haven’t performed as well but are destined to turn it around.
Overall, I was very happy with this project because of the fact that it’s not straightforward and that I had to experience a few things along the way. I learned about the different options that I could use when I encounter missing data, like the missing seasons of minor leaguers, and I also know more about how to evaluate logistic models. In addition, I now have a handy dandy tool for evaluating minor leaguers’ potential success in the future.
