
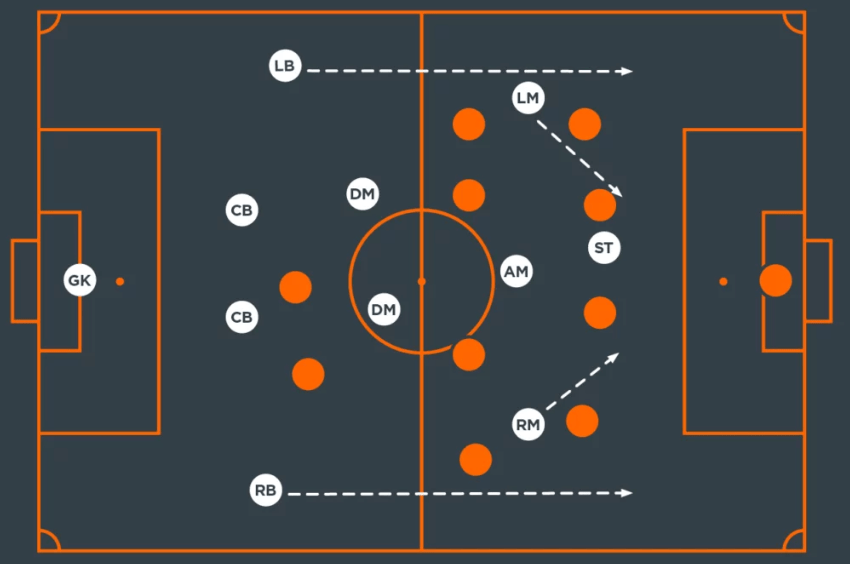
The 4-2-3-1 Triple Threat
John Morris
February 2nd, 2026
In the 2024/25 Premier League season, the 4-2-3-1 was the dominant formation, utilized by over half the league. And although some may account formations in football to just being “phone numbers” (as once stated by Pep Guardiola), the widespread adoption has led to three contrasting interpretations of the system, each prioritizing a different tactical outcome.
Premier League 2024/2025
This analysis will break down these three strategic approaches and argue that the modern use of the 4-2-3-1 system, particularly the reinvented No. 10 and double pivot roles [Ed Notes: “No. 10” refers to the Center Attacking Midfielder, a “Double Pivot” refers to the box-to-box play from the two Central Defensive Midfielders, the two are also commonly referred to as a “No. 8” and No. 6”], is the true reason as to why this system continues to be the most versatile and dominant in the Premier League.
Strategic Breakdowns:
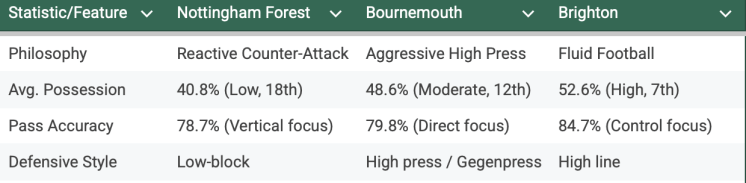
Nottingham Forest
Forest uses the 4-2-3-1 to invite pressure. By maintaining a low-block, they leave space behind the opponent’s defense, inviting all sorts of counter-attacking opportunities.
The Double Pivot: Acts as a shield, focused purely on protection and winning the ball.
The No. 10: Instead of a playmaker, the No. 10 is the primary option for passing out of defense. They receive direct passes and immediately launch vertical assaults to pacey wingers or up front to a center forward.
Bournemouth
Under Andoni Iraola, Bournemouth’s 4-2-3-1 is a tool for disruption. They aim to win the ball as high as possible, leading to low PPDA (Passes Per Defensive Action) figures.
The Double Pivot: Often pushes higher to support the press, with fullbacks covering lots of ground to prevent counter-attacks.
The No. 10: Tasks are primarily defensive, focusing on ruining the opponent’s initial build-up play.
Brighton
Fabian Hürzeler’s Brighton uses the double pivot to control the tempo and fluidity of the match. While they start in a 4-2-3-1, they frequently shift into a 2-4-4 in possession to overload the final third of the pitch.
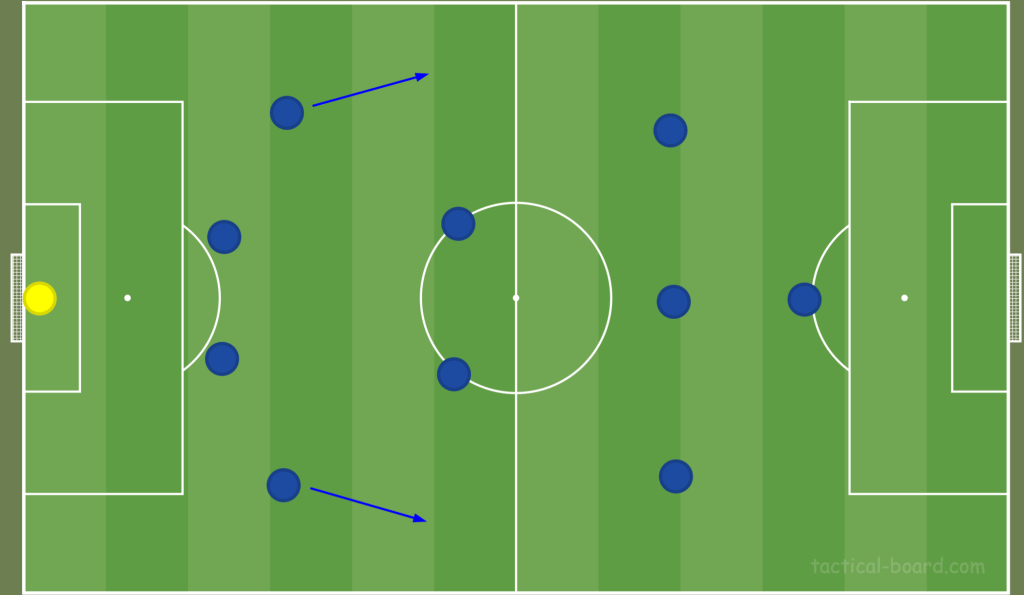
Full-backs shift to jam midfield (forms 2-4-4)
The Double Pivot: One midfielder often drops into the defensive line while the other pushes forward, creating triangles to facilitate vertical passing.
The No. 10: Acts as a playmaker in the space behind the strikers and midfielders, often dropping deep to let the wingers move inside as extra attackers.
The Risks of Each System
Forest: Forest rely heavily on clinical finishing from limited chances. If they concede first, their system can become risky to run when forced to provide an answer. In addition to this, their low-block system invites pressure from their opponents, leading to a larger amount of big chances faced than created.
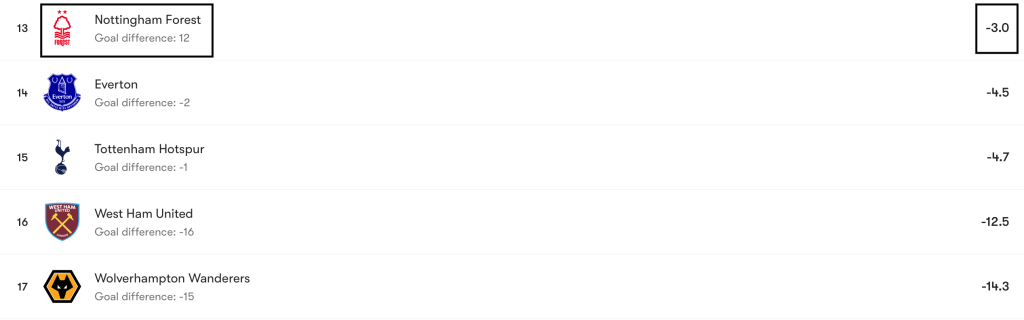
Forest’s xG (Expected Goals) difference indicates reliance on low-volume chances
Bournemouth: The high press is vulnerable to fast recovery, because if the initial press is bypassed, they are exposed to 1v1 situations. With their double pivot often pushing higher to support the press and aim for turnovers, quick clearances from the opponent can leave the No. 6 or fullbacks in a desperate position to recover.
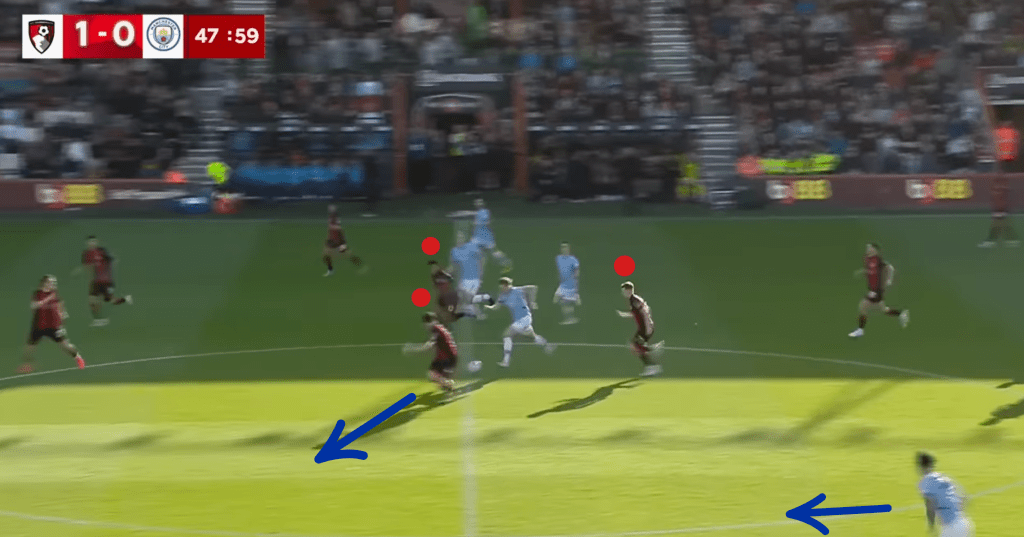
Bournemouth’s midfielders swarm Kevin De Bruyne, who spots Nico O’Reilly making a run
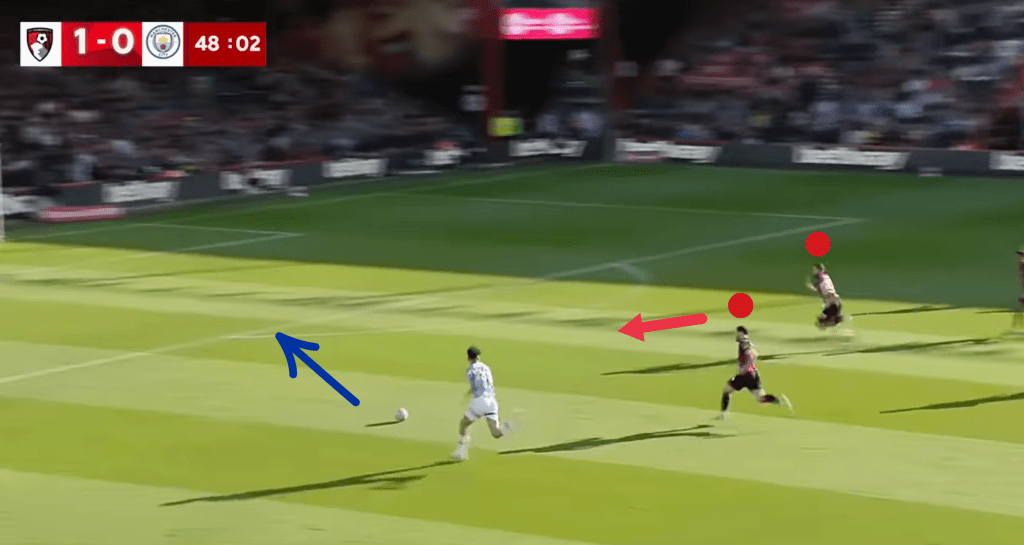
Loads of space for O’Reilly allow him to drift into the 18-yard box and set up an equalizing goal for City
Brighton: Their aggressive, high line approach can leave them vulnerable to the same kind of quick counter-attacks that Forest are known for. In their frequent formation shift from a 4-2-3-1 into a 2-4-4, they commit a large number of players forward. Similarly to Bournemouth, if possession is lost in the midfield or high up the pitch, the two remaining defenders are left with vast amounts of space behind them.
Analyzing the Performance Metrics
The Workhorse: Morgan Gibbs-White (Forest)
Morgan Gibbs-White functions as the Transition No. 10 in Nottingham Forest’s system. While the No. 10 role is traditionally a creative playmaker, Gibbs-White is instead utilized as the team’s primary link for passing out of a defensive shape. His game is defined less by high passing accuracy and more by his defensive contribution and ability to deliver line-breaking passes, a profile which perfectly illustrates Forest’s philosophy of controlled chaos.
Defensive Output: He averaged 2.1 tackles + interceptions per 90, while also contributing his aerial ability, leading the press from the front.
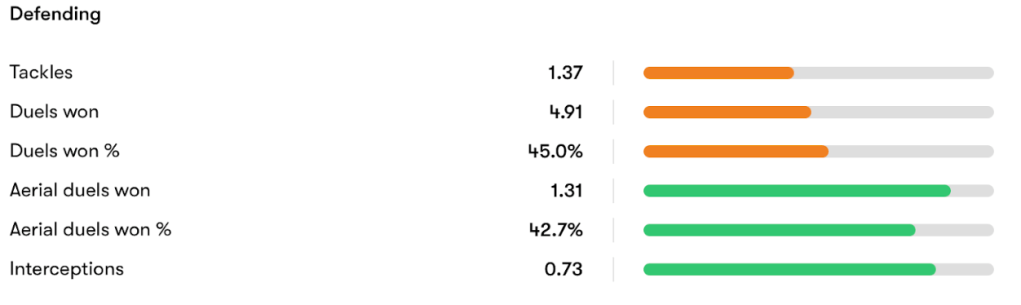
Morgan Gibbs-White 2024/2025
High-Risk Passing: His lower passing accuracy comes as a result of prioritizing line-breaking vertical balls to runners like Anthony Elanga.
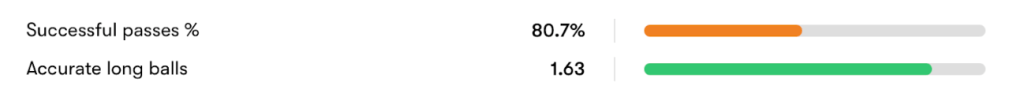
Morgan Gibbs-White 2024/2025
The Pressing Specialists (Bournemouth)
PPDA (Passes Per Defensive Action): Bournemouth consistently registers some of the lowest PPDA numbers in the league (league low 9.9 in the 2024/2025 season), meaning they allow the opponent very few passes before attempting a tackle.
High Turnovers: Their No. 10 and pivot players provide the crucial ability to win the ball back in the final third, focusing on creating turnovers rather than their individual passing production.
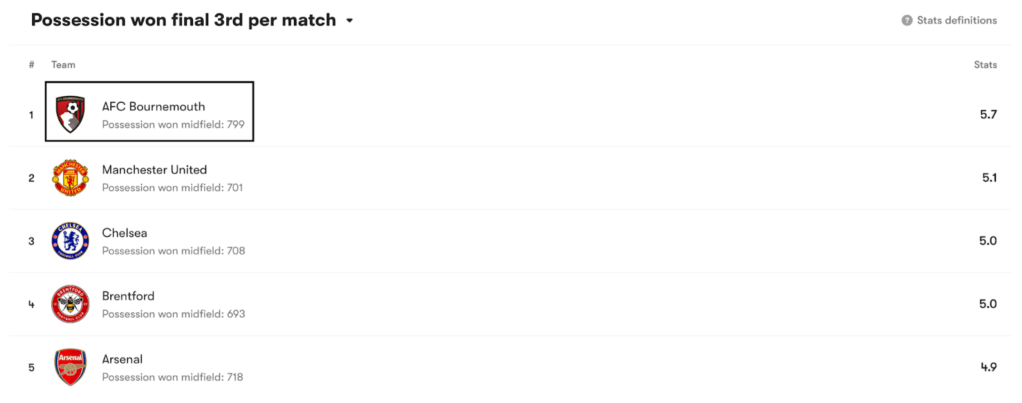
Premier League 2024/2025
The Control Specialists (Brighton)
Passing Volume: Unlike Forest’s 40.8% possession, Brighton’s pivots often see 52.6% or more of the ball, requiring high pass accuracy (84.7%).
Positional Fluidity: The pivot often morphs into a back three or a front four during build-up, in contrast to Forest’s defensive shift into a low-block 4-4-2.
Summary of Impact
The 4-2-3-1, with its Transition No. 10 proves that dominance does not always require control, but rather controlled chaos with a sense of purpose. As more teams adapt to high-pressing schemes, this counter-attacking model provides an efficient, powerful pathway to goal. The real question for the next decade is not if this role will survive, but how deeply its principles will influence changes into every other position, from the ball-playing center-back to the inverted winger. In the years to come, it will be interesting to see how quickly teams continue to adopt this formation and the extent to which positions such as the No. 10 evolve from a traditional to a modern approach, and how this evolution will affect not just a singular formation, but the entire tactical landscape of football.
U.S. Men’s National Team Lineup Selection
Noah Swan and Andrew Daly
August 2nd, 2021
An extra-time penalty from rising star Christian Pulisic was the difference in a tightly-contested CONCACAF Nations League Final as the US Men’s National Team secured a victory over Mexico. More important games are fast approaching with World Cup qualifying coming shortly after the Gold Cup. Following the embarrassment of missing out on the 2018 tournament, the USMNT is back with a stronger, more mature squad. The evolution of the US academy system at club level has led to the export of young talent to European clubs; Gio Reyna, Sergino Dest, and Pulisic played significant roles for powerhouses in the top 5 European leagues (the domestic leagues in England, France, Spain, Germany, and Italy). Coach Gregg Berhalter has the most talented pool of players of any USMNT manager ever.
With the help of Football Reference, this article will take a deep dive into the USMNT players in Europe’s top 5 leagues with the goal of selecting a team going into next year’s World Cup. As Football Reference provides advanced statistics for only these leagues, the analysis will miss out on the following players who have played over 130 minutes for the USMNT: Sebastian Lletget, Kellyn Acosta, Reggie Cannon, Brenden Aaronson, Aaron Long, Ethan Horvath, Jackson Yueill, and Mark McKenzie.
In the United States’ match against Mexico in the CONCACAF Nations League Final, one of the most competitive games the team has played recently, Berhalter opted for a 3-4-3 formation which seems to fit with the talent across the team. An additional center-back can help bolster a back line that likely makes the weakest part of the team. The formation would also allow the fullbacks to play in a more attacking role as wingbacks/wide midfielders, a role Dest, Antonee Robinson, and DeAndre Yedlin could thrive in. There also appears to be a clear midfield two with versatile skill sets that work well in a double pivot. For the sake of this exploration, we will be selecting players into a 3-4-3 formation.
Starting with the goalkeeper, Zack Steffen is the only American representative in Europe’s top 5 leagues. The Manchester City backup received only one start in the Premier League this past season, with 10 more games played in cup competitions. Steffen conceded 6 goals in his 11 games, although facing very few shots on target in those games. The Premier League game against Chelsea in January provides one small datapoint with which to contextualize the performance through advanced statistics.

The x-axis measures each keeper’s Post-Shot xG Plus-Minus per 90. The Post-Shot xG of a shot is the probability a shot results in a goal after the shot is taken. A goalkeeper can be evaluated by comparing the number of goals they concede with the sum value of the Post-Shot xG for all shots against them. For example, if a keeper faces a stellar attack that creates good chances for a total PSxG of 3 but only concedes 1 goal, then his PSxG +/- would be 2 for this game. Dividing the total PSxG +/- by matches played to normalize provides a decent idea of how good a keeper is over a season. Jan Oblak has one of the highest PSxG +/- which is unsurprising given his status as one of the top keepers in the world. Steffen conceded 1 goal on .6 xG in his one match against Chelsea for a PSxG +/- below-average, however he faced higher quality chances. Post-Shot xG per Shot on Target measures the average quality of chances against a keeper. The higher the value, the worse the defense in front of the keeper which concedes consistently good chances for the opposition. In his one game, Steffen faced a higher-than-average PSxG per SoT.
The defense is a little trickier. One of the most challenging aspects of soccer to model statistically is defense. The counting stats like tackles and interceptions do not necessarily correlate to better defensive play. Among defenders, the leaders in tackles won per 90 in the 2019-20 season, minimum 10 matches played, were Gil Bastiao Dias from Monaco and Reinildo Mandava of Lille. Virgil van Dijk sits much lower on the list as do Harry Maguire, Milan Skriniar, Matthijs de Ligt, etc.
With this challenge, we first created a model predicting defensive performance using the advanced statistics provided by football reference. Using the XGBoost algorithm, we attempted to predict Expected Goals Against per 90 for a sample of the 318 teams over the past four seasons. Before creating the models, we made a possession adjustment to tackles and interceptions to get a better understanding of defensive play. A team with 10 tackles in a game should be viewed differently if his team had 90% possession vs 10% possession. Players on high possession teams get a slight boost and vice versa for low possession teams with more chances to intercept or tackle. After adding these features and removing the block and shot block variables which had an outsized effect on the first models, the following variables had the greatest gain when creating the model.

Possession Adjusted Tackles Won per 90 had the greatest gain in the model at a team level, followed by Possession Adjusted Tackles and Tackles in the Defensive Third per 90. Understandably, the model values actions in the defensive third since more tackles in the defensive third means fewer offensive actions for the opponent in the defensive third. A similar line of logic follows for clearances.
Having reviewed these variables, we compared the US defensive options via various statistical categories guided both by the model and by intuition.

The leading center-backs for the United States, John Brooks of Wolfsburg and Chris Richards of Bayern Munich, achieved above-average numbers for both Possession Adjusted Tackles Won per 90 and Tackles in the Defensive Third per 90. Tyler Adams plays for a high pressing RB Leipzig team, so his above-average PAdj. Tackles Won makes sense. The fullbacks, Dest, Robinson, and Yedlin, rank higher in the statistical categories than average for one of the two statistics. Though for the fullbacks/wingbacks, the defensive statistics are less important as the 3-4-3 formation encourages their participation in the attack. Yedlin’s overperformance in Tackles in the Defensive Third per 90 results in part from Newcastle’s conservative play style.

When comparing players using the standard defensive counting stats, it’s Adams that stands above other players. Brooks, Robinson, and Richards achieve above-average numbers in both categories as well. Tim Ream and Timothy Chandler are once again lagging in these statistical categories, but neither featured for either of their club teams. Ream played the first six games for Fulham before playing in the final two, not super encouraging given Fulham’s relegation. Chandler played on and off for Eintracht Frankfurt in the Bundesliga, usually a substitute for the 5th best German team.
Having looked at strictly defensive statistics so far, Chris Richards and John Brooks are locks for the first two center-back spots. Both Ream and Chandler lack the statistical output to warrant a spot, especially when considering their over-30 ages. Berhalter has tested a variety of center-backs in the his lineups recently including Matt Miazga (RSC Anderlecht in Belgium), Mark McKenzie (Genk in Belgium), Aaron Long (NY Red Bulls), Walker Zimmerman (Nashville SC), and Ream to name a few. In favor of selecting a younger center-back in place of Ream or Chandler, we will select one of Miazga, McKenzie, Long, or Zimmerman instead.
With the center-backs selected, we move on to the wingback selections for the team. Fortunately, the US has a couple of options.

To pick fullbacks, we wish to compare the progressive passing and creative talents of the available options. With only two midfielders and three center-backs, the fullbacks would play a large part in the buildup and creation in the final third. In this chart, the y-axis measures Shot Creating Actions, a good indicator of creative output, and Passes into the Final Third, a key aspect of buildup play. The two players that stand out are Dest from Barcelona and Robinson from Fulham. Dest’s inclusion should be no surprise, and his move to Barcelona validates what the numbers show. He ranks highly in many attacking statistics, not surprising for a fullback at Barcelona who will look to play on the front foot and involve their fullbacks in the attack. Robinson shares high ranking statistics in dribbling with Dest despite a much weaker context with relegated Fulham. At 20 and 23 for Dest and Robinson respectively, our picks for fullbacks have plenty of room to grow over the next couple of years. Bryan Reynolds, turning 20 this year for Roma, is another option who needs to continue his development before earning a starting spot in the USMNT.
For the attack and midfield, there are many more useful statistics to analyze output, so it was easier to choose which statistics were important. The players that were eligible to be included in our study were Christian Pulisic, Gio Reyna, Weston McKennie, Josh Sargent, Tim Weah, Yunus Musah, Tyler Adams, Owen Otasowie*, and Matthew Hoppe. We started by looking at who would fill out the two central midfield positions by looking mainly at progressive passes per 90, tackles in the middle and defensive thirds per 90, pressures in the middle third, and pressure success percentage as well as metrics used to measure offensive production.
*Otasowie played less than 3 full matches for Wolverhampton Wanderers, thus his per match statistics are heavily skewed

Progressive Passes per 90 looks at the number of passes that a player had that advanced the ball towards the opposition goal at least 10 yards from the furthest point in the last six passes. Tackles in the Middle and Defensive Thirds per 90 is the number of times that a player stepped in and won the ball defensively. This statistic is more important for midfielders than for forwards because forwards are expected to help less on defense. Adams performed well above-average in both categories which is in part due to playing for an aggressive, pressing RB Leipzig team. McKennie performed very highly in tackles but was below-average in progressive passes. This would lend to the idea that McKennie plays more defensively in his role. Pulisic is roughly average in both indicators although he is slightly lower on tackles than average which is understandable because he mostly played left wing for Chelsea and did not defend as much. Reyna performed slightly below-average in both categories, but it is not too disconcerting. Sargent, Musah, and Hoppe are all extremely low in both categories, but it is most worrying for Musah because the other two play forward.

Pressures in the Middle Third shows how often a player puts pressure on the ball and is a good measurement of aggression for midfielders in a key area of the field. Pressure Success Percentage quantifies how good a player is at winning pressures that he attempts. Adams is again above-average in both categories which further promotes him as one of the best options at midfield. Reyna performed above-average in both categories which makes sense since he plays for a high-pressing Borussia Dortmund team. Pulisic has an average number of pressures in the middle third because that wasn’t his role in Chelsea, but he has an above-average success rate. McKennie pressed frequently but failed to win back possession at an average rate.

Finally we looked at Progressive Carries per 90 and Touches in the Attacking Penalty Area per 90. Progressive Carries indicate a player’s ability to advance possession via dribbling, and Touches in the Penalty Area demonstrates a player’s ability to find pockets of space in the most valuable area of the field. Once again Pulisic and Reyna finish miles ahead of the field as they have rank well above-average in both statistics. The rest of the team finished fairly even, with most above-average in touches in the penalty area but below-average in carries. Adams was the exception as he was above-average in carries but well below-average in touches which is because he does not make many runs forward.
Adams is an obvious choice as one of the central midfielders because he is the strongest defensively out of the group, but can also provide some quality passing. McKennie fills out the other midfield role as he can provide a balance between distribution toward the attacking third and defense.
Next we looked at statistics to understand which players produced the most offensively through progressing the ball, assists, and scoring. To do this we looked at non-penalty expected goals (npxG), non-penalty expected goal plus-minus, shots per 90, shot creating actions per 90 (SCA per 90), expected assists per 90 (xA per 90), and passes in the penalty area per 90.

Non-Penalty Expected Goals (npxG) is a metric that shows the number of goals that a player is expected to score based on certain characteristics about the shot. NpxG filters out penalties in order to adequately evaluate the attacking talent of forwards. Non-Penalty xG Plus-Minus is a decent facsimile for a finishing statistic. None of the players in our search presented exceedingly positive attacking profiles. McKennie, Sargent, Reyna, and Pulisic were the only four attackers to notch a npxG above four, but they all had higher than average npxG. Sargent performed almost perfectly as expected, and Weston McKennie slightly outscored his npxG with five goals compared to 4.2 npxG. Reyna and Pulisic, on the other hand, did not meet the expectations. Pulisic faced the highest level of competition in the Premier League that, when combined with inconsistency of minutes, can help explain the deficiency. None of the players in consideration are prolific attackers which is why even the top four shooters for the U.S. have below six npxG for the season.

A Shot Creating Action (SCA) is any type of move that opens up a shot: a dribble, a pass, or a drawn foul. This metric is best used to see the creativity of players in how well they are able to create opportunities for themselves and their teams. SCA is often a key indicator for the top attacking players, and the leaders in SCA over the past five seasons have included Lionel Messi, Neymar, and Eden Hazard. For this graph, we compared SCA per 90 to Shots per 90 to identify which players are able to create shots for themselves and their teams. Here again, Pulisic and Reyna are the leaders from the US squad and also have numbers above-average. Weah has a very high number of Shots per 90, but does not have many SCA because he is a true striker whose role is simply to score. For Weah, a small sample size of 9.8 matches could factor into the below-average SCA. Sargent performed roughly the same as the average player although his Shots per 90 was slightly above-average. McKennie fell just below-average in Shots per 90, but is above-average in SCA because of his ability to find passes and distribute the ball from the center. Hoppe performed slightly less than average in Shots, but similarly to Weah, had a low SCA. Musah and Adams are both significantly below-average; for Adams this is not shocking because he plays more defensively in his midfield role, but this is very disappointing for Musah as he plays mostly as a wide midfielder with opportunities to attack.

Next, we looked at players’ ability to create opportunities in the final third by looking at Expected Assists (xA) and Passes into the Penalty Area. No surprise here, Pulisic and Reyna lead the team again in this category as both are skilled players who can find ways through and around defenders. McKennie performed better in xA than in Passes into the Penalty Area because his role is more of a hanging central midfielder so he does not move up as much as Pulisic or Reyna to play it into the box. Sargent performed above-average in xA but had very few passes into the penalty area which suggests that he shoots when he is close to the box rather than passing it off. Adams measured average in passes, but was well below-average in xA which might be because of his style being more defense minded. The rest of the squad did not perform very well, and Otasowie’s numbers seem to indicate his role as a more reserved midfielder.
Finally, we looked at some of the frontrunners and compared their stats to the average of all players in the top five leagues. We did this to identify where the American stars really shined and also to see if there was a noticeable difference between them.

As expected, Christian Pulisic shines in attacking statistics. His Progressive Carries per 90 and Passes into the Penalty Area are both in the top 5% of the top five leagues, and his Touches in the Penalty Area is in the 92nd percentile. These three stats indicate that Pulisic is a great dribbler and can also move off the ball to set himself up for opportunities. His SCA per 90 is also very high because of his ability to dribble and connect passes. Pulisic is in the top quarter of players in xG + xA per 90 indicating he could potentially aim for more consistent minutes at Chelsea. For Successful Pressures and PAdj Tackles per 90, Pulisic did not perform much above-average, but his role does not require much defense and he is not known to be a prolific defender.

Similarly to Pulisic, Reyna performed very well across the board. He is in the top eight percent of players in Progressive Carries per 90 which displays his skill in dribbling and moving the ball. In touches in the Penalty Area and Passes into the Penalty Area, Reyna ranks in the 80th percentile which is very good. For xG + xA and SCA per 90, Reyna performed fairly well although not quite as well as Pulisic. Reyna was very good at pressuring, being in the top 30 percent, but was not quite as good at tackles which could be because he does not defend often in his role. Reyna’s numbers are very good overall and he should improve over the next several years as he gets more experience in Europe.

Sargent had a surprisingly high ranking in Successful Pressures (88th percentile) which is not expected from a forward. One potential explanation could be Sargent’s team Werder Bremen’s lack of constant possession, requiring the striker to take on a more defensive role. In all other categories Sargent’s numbers are less than inspiring. He performed slightly above-average in xG + xA, Touches in the Penalty Area, and SCA per 90 which is encouraging but not outstanding. The stats look much worse for Progressive Carries per 90, Passes into the Penalty Area, and PAdj Tackles per 90 in which Sargent ranks in the bottom 30 percent of top five league players. Sargent’s profile paints a conflicted picture; his decent performance in SCA and touches in the penalty area contrasts with his below average Profressive Carries and Passes into the Penalty Area. Playing on the now-relegated Werder Bremen, Sargent had few opportunities to make incisive runs or attacking passes as his team lacked the surrounding firepower to progress the ball effectively. As such, the numbers are not quite as worrying although still not excellent.

Weah’s numbers are equally ambivalent to Sargent’s. He performed very well in xG + xA, Touches in the Penalty Area, and PAdj Tackles per 90 with all in the top 30 percent of players. His Progressive Carries per 90 is roughly average which does not provide confidence in Weah as a consistent dribbler. Similarly to Sargent, Weah’s other stats are well below-average with Successful Pressures, SCA per 90, and Passes into the Penalty Area all in the bottom 30 percent of players. While these numbers are not great, they are not as surprising as Sargent’s because Weah plays as more of a striker which is why his stats are lower for SCA and Passes into the Penalty Area. He more often finds the end of passes into the penalty area, and Weah, as a striker, is more often the one taking the shots. It is very interesting that he ranks so highly in tackles when his Successful Pressure ranking is below 10 percent. As a backup attacker at Lille last season, Weah played as either a striker or sometimes a wide forward in Christoph Galtier’s 4-4-2 system. His profile presents someone less involved in possession progression but effective at creating for himself if not others.
It is clear that Pulisic and Reyna should be the two wingers because they both have incredible skill at creating opportunities and scoring them. They were both above-average in every category we looked at and they are much stronger than any of the other U.S. options. The forward is much more difficult to discern as there is no dominant striker on the squad. We narrowed the options down to Sargent and Weah because they seemed to have the best meaningful statistics. Neither players’ performance can be fully explained because there are discrepancies between which categories they did well in; Sargent was extremely high in Successful Pressures but low in tackles (PAdj tackles per 90) and Weah was high in tackles but low in Successful Pressures. Overall, Weah is more of a true striker as he had a high xG + xA and more touches in the Penalty Area than Sargent. For now, the choice is Sargent because he has more playing experience and creates more opportunities for his teammates. Sargent provides more flexibility at the striker position, allowing Pulisic and Reyna to cut inside without worrying about traffic. This is a tight battle, but Weah does not have the holistic profile to warrant a starting position at this time.

This completed team provides a reasonable idea for what to expect from the USMNT during the 2022 World Cup. While there are some locks like Pulisic or Reyna, other players outside of this analysis could play themselves into the lineup. With one more season until the games begin in Qatar, the horizon shines bright for the USMNT.
