
The Serve Score: An Analysis of a New Advanced Tennis Metric
Noah Swan
January 25th, 2021
In the final of the Italian Open in Rome during the 2019 season, world #1 Novak Djokovic faced world #2 Rafael Nadal in a clash of giants. The two had met earlier in the season in Melbourne, with the Serb handling his opposition in straight sets. Djokovic would go on to add a trophy in Madrid en route to a nine-match winning streak before facing a struggling Nadal in the final. Struggling may be too harsh for one of the all-time greats, but he lacked the silverware of his opponent in the months leading up to Rome. Losses to Dominic Thiem, Stefanos Tsitsipas, and Fabio Fognini denied him chances to further cement his clay-court dominance. In hindsight, Nadal would win the Rome Masters before running through Roland Garros, dropping three total sets during the two tournaments. During his second matchup with Djokovic in the heat of the Italian summer, Rafa embarrassed his opponent with six straight games in the first set before cruising to a three-set victory for his first title of the season. In the match, Djokovic fired seven aces, but Nadal won 61% of his second serve points. Djokovic trumped Nadal in first serve accuracy, but Nadal protected his first serve better. Although Nadal won, who served better? We would lean Nadal, but how important is each serving statistic in determining the outcome of a match?
If we wanted to create a metric to incorporate all serve statistics, we would need some way of determining the importance of each statistic on the outcome of a match. Enter mutual information: the method I used for scaling a holistic serve metric. I can attempt to explain mutual information based on a handful of YouTube videos and Wikipedia. Information theory involves the interaction of information, uncertainty, and entropy. One bit of information, the common unit of measurement, is defined as the information in one flip of a coin. I’m sure a math professor or computer science professor would cringe at that definition, but it’s really just background for the concept of mutual information. This is how I can best describe mutual information: it quantifies how much information about the distribution of one random variable is provided by another random variable. For example, let’s say we have two random variables: A and B. In this example, if we know everything about A, then we can predict B at a high level of accuracy. This would equate to a high value for mutual information. It is a similar concept to linear correlation, which is an alternative method for calculating the weights.
With that of the way, we can get into the tennis data. Using every match from 2015 to 2020, the mutual information was calculated between six serve variables: ace percentage (aces/total serve points), double fault percentage, percentage of first serves in, percentage of first-serve points won, percentage of second serve points won, and break point faced percentage (break points faced/serve points). The coefficients for the formulas were then determined by the portion of the total of each mutual information value (i.e. added all the mutual information values together and divided each by the total to get the coefficient). This is the formula for Serve Score:
0.064 * (Ace Percentage) + 0.323 * (First Serve Won Percentage) + 0.015 * (First In Percentage) + 0.264 * (Second Won Percentage) – 0.025 * (DF Percentage) – 0.31 * (BPs Faced Percentage)
With that formula, let’s look at the top serving performances in the past six years. The Serve Scores have been proportionally converted to a scale of 1-100 to make life easier, and I filtered out any matches with less than 60 serves in the match. The Serve Score (scaled) can be understood through this example: Player A with a Serve Score (scaled) of 90 produced a serve performance better than 90% of all other serve performances over the past six years.
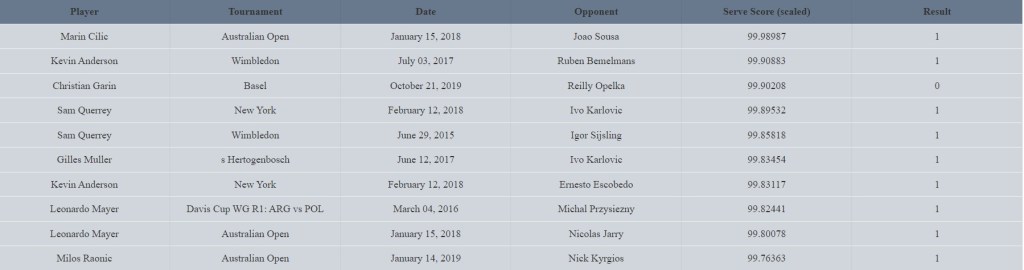
This makes sense in theory. Most of the players on this list are notably huge servers: Milos Raonic, Kevin Anderson, Marin Cilic. All the matches took place on hard and grass courts, which again resonates. I have three observations about this list that I think are notable. First, there are three matches here from the Australian Open. If I were forced to make a guess other than small sample randomness, I would suggest that the fact this tournament comes early in the year may lead to some one-sided matches. Second, many of the opponents here are also big servers, namely Ivo Karlovic, Nick Kyrgios, and Reilly Opelka. While these players may provide some of the best serve performances, they may also supply some of the worst return performances. Finally, one of the top 10 serve performances resulted in a loss, that being Christian Garin’s bout with Opelka at 2019 Basel. The American took the match in two tiebreaks, neither player facing a break point in the match. Opelka’s scaled Serve Score ranked 34th overall as both players served in the 99th percentile of matches in the past six years. Garin’s second serve point won percentage was 94% compared to 63% for Opelka which explains the minor difference. Now let’s flip the table to take a look at the bottom 10 serve performances.
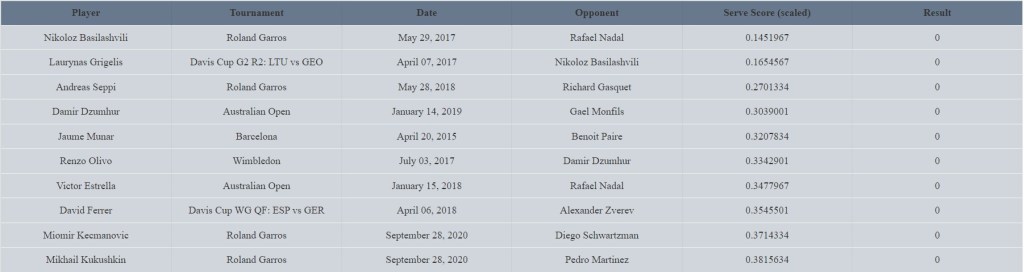
The first thing I notice from the bottom performances is that seven of the 10 worst serve performances came at Grand Slam tournaments. Take the match between Nadal and Victor Estrella in Melbourne as an example. The world #1 playing during the round of 128 at any Grand Slam is likely to strongly favor the former as Nadal exemplified here. One separate prediction would be that notably good returners would cause some of the worst serve performances. Djokovic, a notable returner, was the opponent in 33 matches where the server produced a Serve Score in the bottom 5% of all Serve Scores, two of which were top 10 players. Nadal was the opponent in 12 matches where the server scored in the bottom 5% of Serve Scores… at Roland Garros alone.
Now, instead of looking at the best matches, we can look at the best returners on average over the past six years who played at least 15 matches.
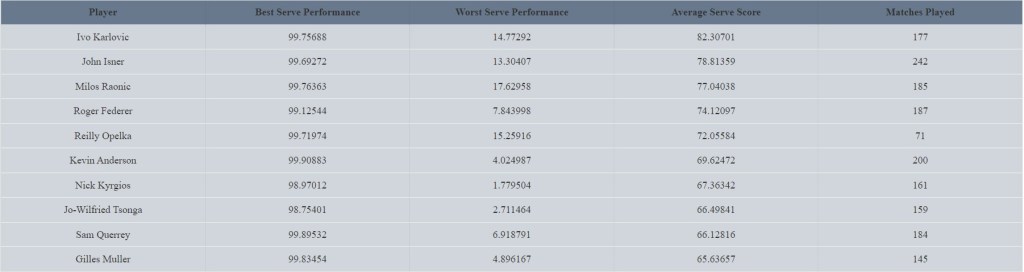
Not a ton of surprises on this list, and these results may suggest Serve Score is relatively accurate. The variance between best and worst matches for the top servers. Milos Raonic had the second-highest Worst Serve Performance of all players, but that match still saw him serve worse than 82.4% of other performances. Ivo Karlovic leads the way in Average Serve Score at 82.31 which means on average, he produced a serve performance better than 82.31% of all serving lines during the period. To do that over 177 matches is staggering. Taking a broader view of Average Serve Scores, 60-65 seems like a good mark to set for the elite servers over an extended period. Following the elite class of servers is the average area around 45-55 Average Serve Score. Sustained tour success is a difficult proposition for many players below the 35-40 mark. Diego Schwartzman is the only player below a 35 Average Serve Score who achieved a top 10 ranking during the period.
Serve Score delivers some interesting insights into players and matches over the past six seasons. Some areas leave room for future exploration though. Mutual information may or may not be the best method to determine the Serve Score formula. I am skeptical about the weighting of break points as they have a strong negative effect on the metric. As mentioned earlier, linear correlation could be a separate avenue to use for serve performance. The output and analysis suggest mutual information could prove useful.
The charts above capture only a fraction of the entire dataset. Analysis of a certain year, player, or matchup could bear interesting conclusions. This model also allows for expansion into past matches or those in the future.
